UC-Check
This repository is the software artifacts for MICRO ‘21 entitled “UC-Check: Characterizing Micro-operation Caches in x86 Processors and Implications in Security and Performance”.
The artifacts consist of three parts: (1) Diags (microbenchmarks to extract hidden features in uop caches), (2) Usecase 1 (side-channel attack Proof-of-Concept codes), and (3) Usecase 2 (logical uop cache partitioning).
Please refer to the detailed instructions below.
Diags
We first introduce Diags, microbenchmarks for reverse engineering uop cache’s various hidden features: (1) the number of uops in a single uop cache entry, (2) set/way sizes, (3) x86 instruction window size, (4) mapping (set indexing) policy, (5) replacement policy, and (7) sharing policy between logical cores in the same physical cores.
All microbenchmarks and scripts (run, parser, …) are located in a directory /diags.
Diag - Window size
This diag extracts the window size of an uop cache.
How to build & use
Required packages => cmake, make, perf tools
$cd {REPO_HOME}/diags/sharing_policy
$sudo ./script_window/run_all.sh {custom_test_name}
The script run_all.sh automatically builds and tests various combinations.
Also, the script automatically detects the CPU vendors (i.e., Intel, AMD), and sets corresponding perf events and core ids for the evaluation.
When run_all.sh is finished, raw data are stored in expdata/{custom_test_name}_{timestamp} directory.
To parse the raw data, you can run the following commands.
$./scripts/parse_all.py --test expdata/{custom_test_name}_{timestamp}
You can get the results with different code chunk sizes (16, 32, 64, 128).
Diag - Maximum number of uops
This diag extracts the maximum number of uops in a single uop cache entry.
How to build & use
Required packages => cmake, make, perf tools
$cd {REPO_HOME}/diags/sharing_policy
$sudo ./script_numUop/run_all.sh {custom_test_name}
The script run_all.sh automatically builds and tests various combinations.
In the script, you must make sure that SMALLER_CHUNK is not larger than the window size of the target uop cache for the correction reversing.
Also, the script automatically detects the CPU vendors (i.e., Intel, AMD), and sets corresponding perf events and core ids for the evaluation.
When run_all.sh is finished, raw data are stored in expdata/{custom_test_name}_{timestamp} directory.
To parse the raw data, you can run the following commands.
$./scripts/parse_all.py --test expdata/{custom_test_name}_{timestamp}
You can get the results with different number of NOPs in a code chunk (from 4 to 10).
Diag - Mapping policy
By using this diag, we can extract uop cache’s set/way sizes, instruction window size, and set indexing policy. Also, we can distinguish the uop cache replacement policy (whether perfect LRU or not).
How to build & use
Required packages => cmake, make, perf tools
$cd {REPO_HOME}/diags/mapping_policy
$sudo ./script/run_all.sh {custom_test_name}
The script run_all.sh automatically builds and tests various combinations (set/way/window sizes).
In the script, you should modify MAX_SET_SIZE, MAX_WAY_SIZE, and CODE_CHUNK_SIZES to change these combinations for profiling.
Also, the script automatically detects the CPU vendors (i.e., Intel, AMD), and sets corresponding perf events and core ids for the evaluation.
When run_all.sh is finished, raw data are stored in expdata/{custom_test_name}_{timestamp} directory.
To parse the raw data, you can run the following commands.
$./scripts/parse_all.py --test expdata/{custom_test_name}_{timestamp}
Then, you get the parsed csv-format results which can be loaded by using pandas.
Now, you can analyze the results for your own purposes.
A simple example (with jupyter) is below.
import pandas as pd
import numpy as np
import matplotlib.pyplot as plt
import seaborn as sns
def cal_perfstat(_df, cal_type):
if cal_type == "ipc":
_df["IPC"] = (_df["instructions"] / _df["cycles"])
elif cal_type == "uop_ratio":
_df["UOP_RATIO"] = (_df["uop_decoder"] / _df["instructions"])
return _df
def do_df_parse(_df):
_df_pivot = _df.pivot_table(values="counter_val",
columns=["counter_type"],
index=["chunk_size", "way_size", "set_size"])
_df_cal = cal_perfstat(_df_pivot, "ipc")
_df_cal = cal_perfstat(_df_cal, "uop_ratio")
_chunk_sizes = _df["chunk_size"].drop_duplicates().to_numpy()
_chunk_sizes.sort()
return (_chunk_sizes, _df_cal)
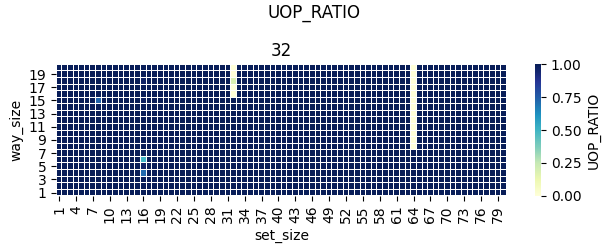
def draw_heatmap(df_parsed, val_type, np_chunk_sizes):
fig, axes = plt.subplots(len(np_chunk_sizes))
fig.suptitle("%s"%(val_type))
axes_list = axes.ravel()
for chunk_size_idx, chunk_size in enumerate(np_chunk_sizes):
ax = axes_list[chunk_size_idx]
ax.set_title("%s"%(chunk_size))
df_tmp = df_parsed.loc[chunk_size, :, :][val_type].unstack("set_size")
df_tmp = df_tmp.reset_index(level=['chunk_size'], drop=True)
if (val_type == "UOP_RATIO"):
sns.heatmap(df_tmp, cmap="YlGnBu", vmax=1, vmin=0, ax=ax, linewidths=.005,
cbar_kws={'label': 'UOP_RATIO'})
else:
sns.heatmap(df_tmp, cmap="YlGnBu", ax=ax, linewidths=.005,
cbar_kws={'label': val_type})
ax.invert_yaxis()
fig.tight_layout()
###############
df = pd.read_csv("{Your csv file path}")
np_chunk_sizes, df_parsed = do_df_parse(df)
draw_heatmap(df_parsed, "UOP_RATIO", np_chunk_sizes)
plt.show()
You can get the following results (included in our MICRO paper) => Example_results
For debugging purposes, you can use
objdump_code_block.shto dump the assembly code used in this microbenchmark.
Diag - Sharing policy
This diag can extract the sharing policy between co-located SMT threads in the same physical cores.
How to build & use
Required packages => cmake, make, perf tools
$cd {REPO_HOME}/diags/sharing_policy
$sudo ./script_sharing/run_all.sh {custom_test_name}
The script run_all.sh automatically builds and tests various combinations.
In the script, you should modify -t TYPE_OF_UOP and -c CODE_CHUNK_SIZE to configure the inner element and the size of a code chunk to use.
To be specific, TYPE_OF_UOP is a number from 1 to 11. The numbers from 1 to 10 map to 2_BYTE_NOP to 11_BYTE_NOP. The number 11 maps to an integer operation.
Next, you should modify `WINDOW’ with the result from the Diag for the window size.
Additionally, you can choose the number of NOPs to fill a code chunk with the option -n (default is five 4-Byte Nop).
Also, the script automatically detects the CPU vendors (i.e., Intel, AMD), and sets corresponding perf events and core ids for the evaluation.
The overall flow of this diag consists of two parts. First, it launches a single diag thread sweeping a code block filled with NUM_CHUNKS code chunks. The configuration for NUM_CHUNKS can be found in run_all.sh (from 2 to 2048).
Second, it launches two diag threads having a different number of code chunks (e.g., 128 vs. 1024). The result will show the effect of the conflict between the two SMT threads.
When run_all.sh is finished, raw data are stored in expdata/{custom_test_name}_{1st_code_chunk_number}_{2nd_code_chunk_number}_{pid_suffix} directory.
To parse the raw data, you can run the following commands.
$./scripts/parse_all.py --test expdata/{custom_test_name}_{timestamp}
Then, you get the parsed csv-format results which can be loaded by using pandas.
You can get the results with different pairs of the number of chunks (from 2 to 2048).
Usecase 1 - Security Vulnerability
The first usecase is the security vulnerability of uop caches.
As stated in our MICRO paper, current modern uop caches can be used as a new timing side-channel.
In this usecase, we present two attack scenarios (i.e., cross-SMT thread attack, speculative execution attack) and their proof-of-concept exploit codes.
We describe how to build and test each attack code below.
Usecase 1 - Cross-SMT thread attack
This attack scenario exploits the microarchitectural state marked in uop cache due to the sharing between SMT threads. As the instructions of the other SMT thread taint the uop cache in the same physical core, uop cache can be used as a new timing side-channel.
How to build and use
Required packages => make
$cd {REPO_HOME}/usecases/cross-SMT
$./run.sh
Then, this script runs the victim and the spy threads on different logical cores in the same physical core in parallel.
The Spy thread prime-and-probe the uop cache, and after the extraction finishes, the attack finishes.
You may configure {REPO_HOME}/usecases/cross-SMT/global.h to apply the architectural configs.
In addition, you may have to change --falign-functions=n to find the result with less noise.
After the attack finishes, you may get the result of the measured latency. The snippet below shows the latency measured at the target set 26.
<set, probe-idx, latency>

. . .

26,42,288
26,43,288
26,44,288
26,45,288
26,46,216
26,47,216
26,48,216
26,49,180
26,50,180
26,51,216
26,52,216
26,53,180
26,54,216
26,55,216
26,56,216
26,57,216
26,58,216
26,59,216
26,60,288
26,61,288
26,62,288
26,63,288
26,64,252
26,65,216
26,66,216
26,67,216
26,68,216
26,69,216
26,70,216
26,71,216
26,72,216
26,73,216
26,74,216
26,75,216
26,76,216
26,77,180
26,78,252

. . .
Usecase 1 - Speculative execution attack
This attack scenario exploits the transient execution CPU vulnerability that exists in modern processors in which the speculative execution is implemented. As the speculatively executed instructions taint the uop cache, we use uop cache as a new timing side-channel to extract this information leak.
How to build
Required packages => cmake, make
$cd {REPO_HOME}/usecases/spectre_uopcache
$mkdir build
$cd build
$cmake ..
$make
Now you can get an executable binary spectre_uopcache.
How to use
Run the compiled binary.
$./spectre_uopcache
Then, you can get the results as follows.
Reading 40 bytes:
Reading at malicious_x = 0xffffffffffffdfd0... Success: 0x54='T' score=9    (second best: 0xF6 score=2)
Reading at malicious_x = 0xffffffffffffdfd1... Success: 0x68='h' score=9    (second best: 0x17 score=2)
Reading at malicious_x = 0xffffffffffffdfd2... Success: 0x65='e' score=9    (second best: 0xB1 score=2)
Reading at malicious_x = 0xffffffffffffdfd3... Success: 0x20=' ' score=11    (second best: 0xF7 score=3)
Reading at malicious_x = 0xffffffffffffdfd4... Success: 0x4D='M' score=11    (second best: 0x2D score=3)
Reading at malicious_x = 0xffffffffffffdfd5... Success: 0x61='a' score=11    (second best: 0x52 score=3)
Reading at malicious_x = 0xffffffffffffdfd6... Success: 0x67='g' score=9    (second best: 0x30 score=2)
Reading at malicious_x = 0xffffffffffffdfd7... Success: 0x69='i' score=9    (second best: 0x52 score=2)
Reading at malicious_x = 0xffffffffffffdfd8... Success: 0x63='c' score=9    (second best: 0x52 score=2)
Reading at malicious_x = 0xffffffffffffdfd9... Success: 0x20=' ' score=9    (second best: 0xA2 score=2)
Reading at malicious_x = 0xffffffffffffdfda... Success: 0x57='W' score=9    (second best: 0x52 score=2)
Reading at malicious_x = 0xffffffffffffdfdb... Success: 0x6F='o' score=11    (second best: 0x52 score=3)
Reading at malicious_x = 0xffffffffffffdfdc... Success: 0x72='r' score=11    (second best: 0x52 score=3)
Reading at malicious_x = 0xffffffffffffdfdd... Success: 0x64='d' score=15    (second best: 0x0B score=5)
Reading at malicious_x = 0xffffffffffffdfde... Success: 0x73='s' score=9    (second best: 0x9C score=2)
Reading at malicious_x = 0xffffffffffffdfdf... Success: 0x20=' ' score=11    (second best: 0x2D score=3)
Reading at malicious_x = 0xffffffffffffdfe0... Success: 0x61='a' score=11    (second best: 0x77 score=3)
Reading at malicious_x = 0xffffffffffffdfe1... Success: 0x72='r' score=15    (second best: 0x0B score=5)
Reading at malicious_x = 0xffffffffffffdfe2... Success: 0x65='e' score=9    (second best: 0x77 score=2)
Reading at malicious_x = 0xffffffffffffdfe3... Success: 0x20=' ' score=9    (second best: 0x9C score=2)
Reading at malicious_x = 0xffffffffffffdfe4... Success: 0x53='S' score=11    (second best: 0x17 score=3)
Reading at malicious_x = 0xffffffffffffdfe5... Success: 0x71='q' score=11    (second best: 0x0B score=3)
Reading at malicious_x = 0xffffffffffffdfe6... Success: 0x75='u' score=11    (second best: 0x0B score=3)
Reading at malicious_x = 0xffffffffffffdfe7... Success: 0x65='e' score=11    (second best: 0x0B score=3)
Reading at malicious_x = 0xffffffffffffdfe8... Success: 0x61='a' score=15    (second best: 0x0B score=5)
Reading at malicious_x = 0xffffffffffffdfe9... Success: 0x6D='m' score=9    (second best: 0x13 score=2)
Reading at malicious_x = 0xffffffffffffdfea... Success: 0x69='i' score=9    (second best: 0x17 score=2)
Reading at malicious_x = 0xffffffffffffdfeb... Success: 0x73='s' score=9    (second best: 0x17 score=2)
Reading at malicious_x = 0xffffffffffffdfec... Success: 0x68='h' score=15    (second best: 0x0D score=5)
Reading at malicious_x = 0xffffffffffffdfed... Success: 0x20=' ' score=13    (second best: 0x0D score=4)
Reading at malicious_x = 0xffffffffffffdfee... Success: 0x4F='O' score=11    (second best: 0x0D score=3)
Reading at malicious_x = 0xffffffffffffdfef... Success: 0x73='s' score=15    (second best: 0x0D score=5)
Reading at malicious_x = 0xffffffffffffdff0... Success: 0x73='s' score=9    (second best: 0x13 score=2)
Reading at malicious_x = 0xffffffffffffdff1... Success: 0x69='i' score=9    (second best: 0x32 score=2)
Reading at malicious_x = 0xffffffffffffdff2... Success: 0x66='f' score=13    (second best: 0x0D score=4)
Reading at malicious_x = 0xffffffffffffdff3... Success: 0x72='r' score=11    (second best: 0x07 score=3)
Reading at malicious_x = 0xffffffffffffdff4... Success: 0x61='a' score=11    (second best: 0x0B score=3)
Reading at malicious_x = 0xffffffffffffdff5... Success: 0x67='g' score=15    (second best: 0x0E score=5)
Reading at malicious_x = 0xffffffffffffdff6... Success: 0x65='e' score=25    (second best: 0x0D score=10)
Reading at malicious_x = 0xffffffffffffdff7... Success: 0x2E='.' score=9    (second best: 0xAE score=2)
As the results show, we successfully read unauthorized secret data by using the uop cache as a new timing side-channel.
Usecase 2 - Uop Cache Aware Logical Partitioning
The second usecase is the logical uop cache partitioning. To show the impcats of the proposal, we modify Java Virtual Machine (JVM) to support logically partitioning the uop cache based on the mapping policy extracted by using Diags.
How to build
First, you should prepare openJDK build environment. Please follow the instructions below.
- Download openJDK 8 source code
git clone https://github.com/openjdk/jdk8u - Download openJDK 7 at here
- Install various libraries required to build JDK
sudo apt-get install build-essential autoconf make libfreetype6-dev libcups2-dev libx11-dev libxext-dev libxrender-dev libxrandr-dev libxtst-dev libxt-dev libasound2-dev libffi-dev libfontconfig1-dev
Then, apply our diff patch to openJDK8 you downloaded.
$cd {jdk8_source_repository}
$git appy {REPO_HOME}/usecases/logical_partitioning/source.patch
$bash configure --with-boot-jdk={jdk7_directory_path} --with-extra-cflags=-Wno-error --with-extra-cxxflags=-Wno-error --enable-debug-symbols --with-debug-level=fastdebug
$make all
Now you can get the compiled JAVA build/linux-x86_64-normal-server-fastdebug/jdk/bin/java.
How to use
There are four options
- UCModifyMode
- -1: original
- 1: Isolation mode (UCIsolationType)
- UCIsolationType
- -1: nothing
- 0: first half
- 1: second half
- UopCacheSetCount
- The number of set lines in a target uop cache default:32
- UopCacheWindowSize
- UopCache window size (AMD:64 // Intel:32) default:64
Publication
This work has been published in MICRO ‘21 (Lightning talk, Main talk)